.jpg)
Trade data: Facts and figures in 2013
VGP - Export turnover valued US$ 132.2 billion, up 15.4% against 2012. Domestic sector earned US$ 43.8 billion in export turnover (up 3.5% against last year).
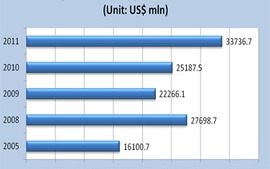
Exports of primary and manufactured products in 2005-11
Trade Value 30/12/2013 13:41VGP – Exports of primary products increased from US$ 16 billion in 2005 to US$ over 33 billion in 2011. Meanwhile, manufactured products surged sharply by nearly four times in the 2005-11 period.
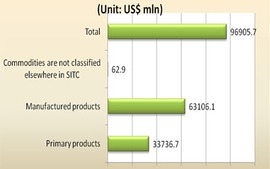
Exports of goods by SITC in 2011
Trade Value 30/12/2013 12:13VGP – Exports of goods in 2011 touched over US$96 billion in 2011 of which manufactured products valued US$ 63 billion and primary products over US$ 33.7 billion.
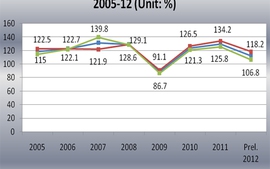
Index of exports and imports in 2005-12
Trade Value 25/11/2013 14:28VGP – Total exports and imports of goods increased sharply in 2007 at 131.4% in the 2005-12 period in which exports picked up 121.9% and imports 139.8%.
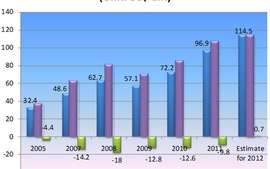
Trade volume in 2005-2012 period
Trade Value 22/11/2013 15:26VGP – Export revenue increased sharply by over 3.5 times in the 2005-2015 period. Trade balance shifted from deficit to surplus in 2012 with US$ 0.7 billion.
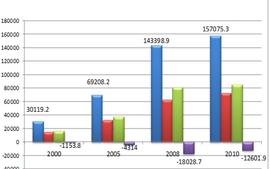
Exports and imports of goods in 2000-2010
Trade Value 22/11/2013 14:39VGP – Total trade revenue increased sharply from US$30 billion in 2000 to over US$ 157 billion in 2010. Meanwhile, trade deficit widened from US$11 billion in 2000 to US$12 billion in 2010.
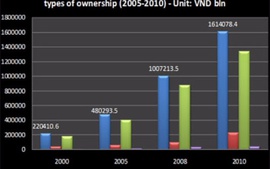
Retail sales of goods and services in 2005-2010
Trade Value 14/08/2013 16:26VGP - The retail sales of goods and services at the current prices by types of ownership were relatively stable between 2005 and 2010.
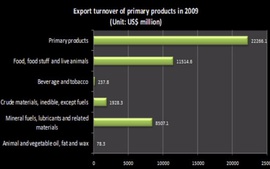
Export turnover of primary products from 2007 to 2010
Trade Value 14/08/2013 16:21VGP - The export turnover of primary products surged to more than US$27 billion in 2008 from over US$21 billion a year earlier before falling to above US$22 billion in 2009.